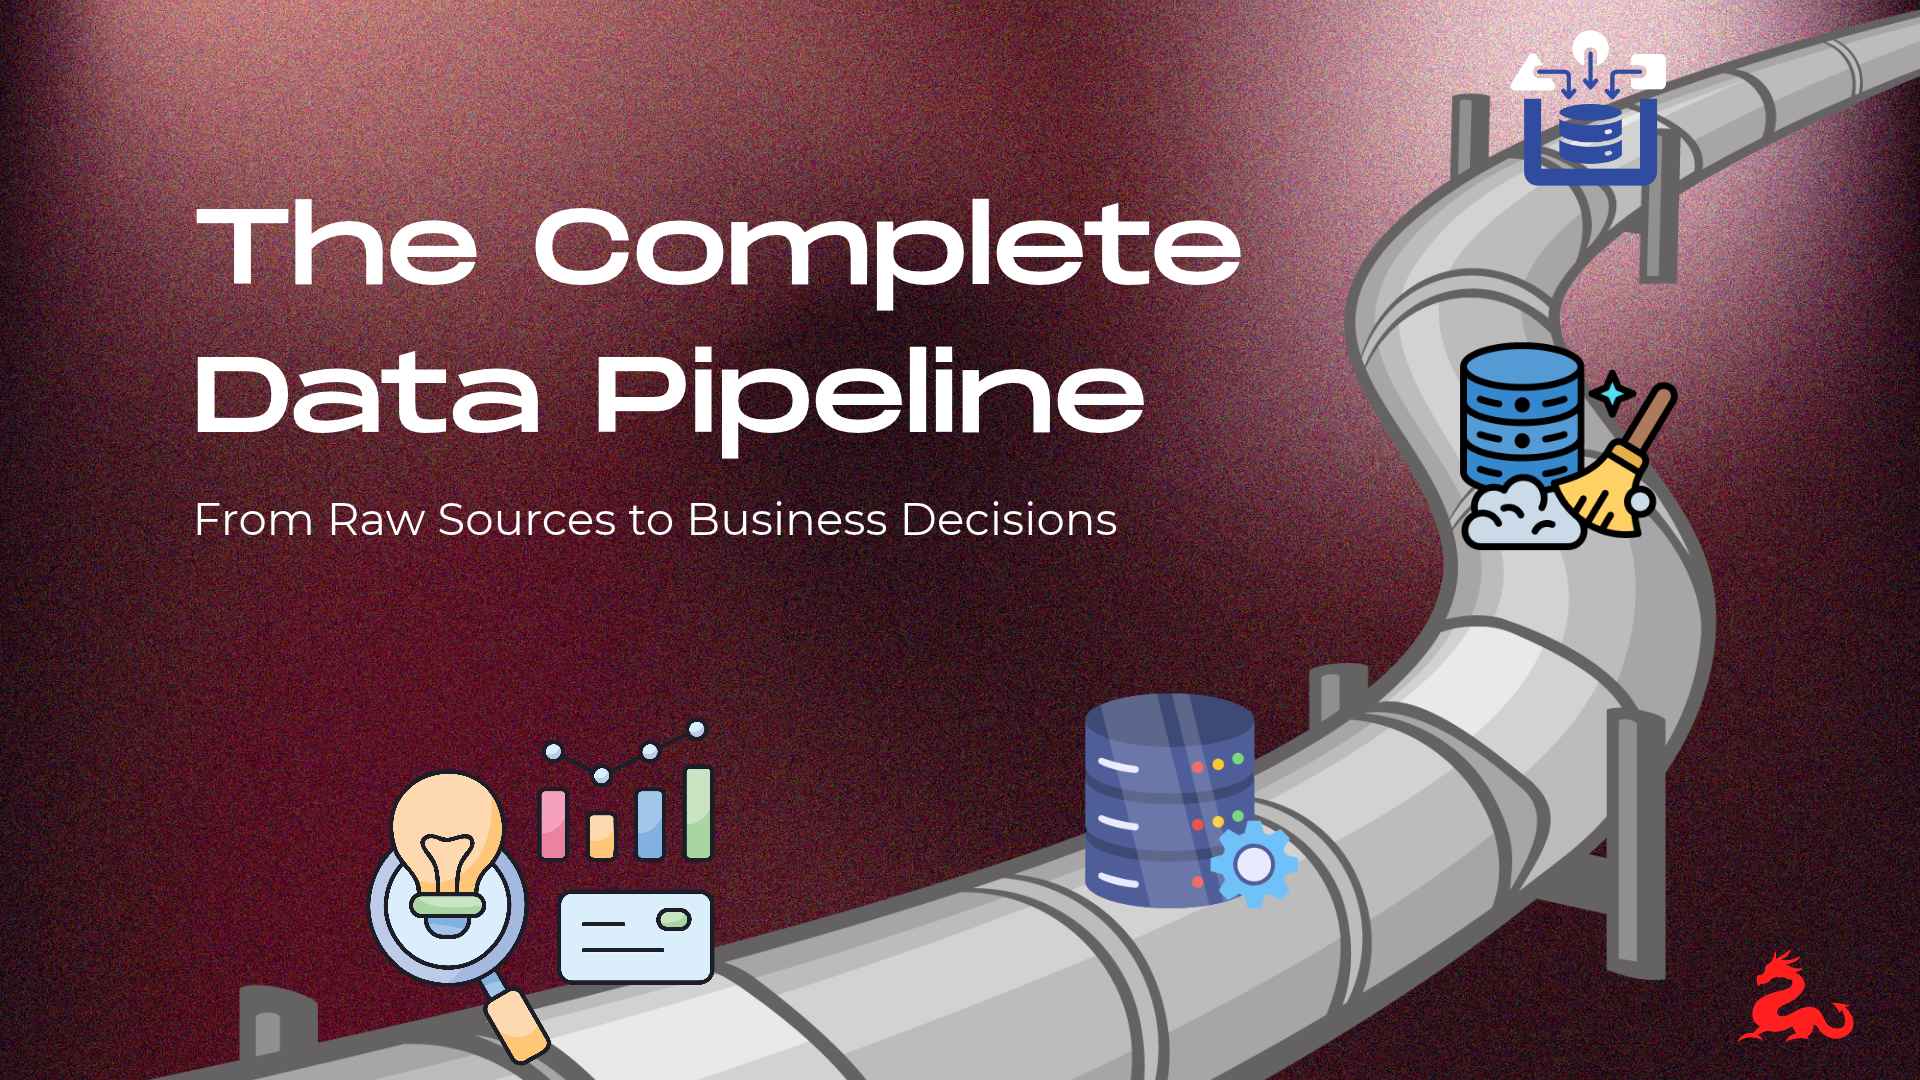
In 2025, data pipelines are the lifeblood of every digital enterprise. They connect raw data sources to the decision makers who rely on timely, accurate insights. But what does the complete process look like, and who plays a role in making it work? Let’s break it down step by step.
Sources of Data
Data originates from countless places: transactional databases, IoT sensors, APIs, social media feeds, customer interactions, and enterprise applications. These diverse inputs form the raw material that fuels the pipeline.
Data Engineers & Data Architects
Data Engineers design and maintain the ingestion systems that pull data from sources into the pipeline. They ensure data is cleaned, validated, and moved efficiently.
Data Architects define the blueprint: deciding whether data should live in SQL databases, NoSQL stores, or document-oriented systems. They ensure scalability and reliability.
Retail
A retail company ingests sales transactions, website clickstreams, and inventory updates. Engineers build connectors to capture this data in real time, while architects design a hybrid system: SQL for structured sales data, NoSQL for clickstream logs, and document stores for product catalogues.
Data Analysts
Analysts are the translators. They query the curated datasets, build dashboards, and generate reports. Their job is to answer “what happened” and “why” by identifying trends, anomalies, and opportunities.
Logistics
An analyst at a logistics firm uses pipeline data to show delivery delays by region, helping operations teams adjust routes.
Data Scientists
Scientists take analysis further by building predictive models. They explore data, test hypotheses, and create algorithms that forecast outcomes.
Finance
A data scientist at a bank uses historical transaction data to build a fraud detection model, flagging suspicious activity before it impacts customers.
Machine Learning Engineers
ML engineers operationalise models. They take prototypes from data scientists and deploy them into production systems, ensuring they scale and perform reliably.
Healthcare
In healthcare, an ML engineer deploys a model that predicts patient readmission risk, integrating it into hospital systems so doctors see alerts in real time.
Researchers
Researchers use data to explore new questions and push boundaries. They may not be focused on immediate business outcomes but on discovering patterns, correlations, or innovations.
Research
Climate researchers integrate satellite data, weather models, and historical records to study long-term environmental changes.
C-Suite & Managers
Executives and managers use the outputs of the pipeline to make strategic decisions:
- What products to launch.
- Where to expand.
- Why performance is trending up or down.
- How much to invest in new initiatives.
Decisions
A CEO uses pipeline-driven dashboards to decide whether to expand into a new market, based on customer demand and operational efficiency.
How Long Does It Take?
Building and operationalising a complete data pipeline is not instantaneous. According to industry research in 2025 (Matillion & YES.AI), the average time to design, implement, and stabilise a modern pipeline is 3 to 6 months, depending on complexity and scale. Automation and cloud-native tools are reducing this timeline, but governance, testing, and integration still require careful planning.
A data pipeline is more than technology; it’s a collaboration across engineers, analysts, scientists, ML experts, researchers, and executives. When done right, it transforms raw information into decisions that shape the future of organisations.